Tuesday, February 17, 1998
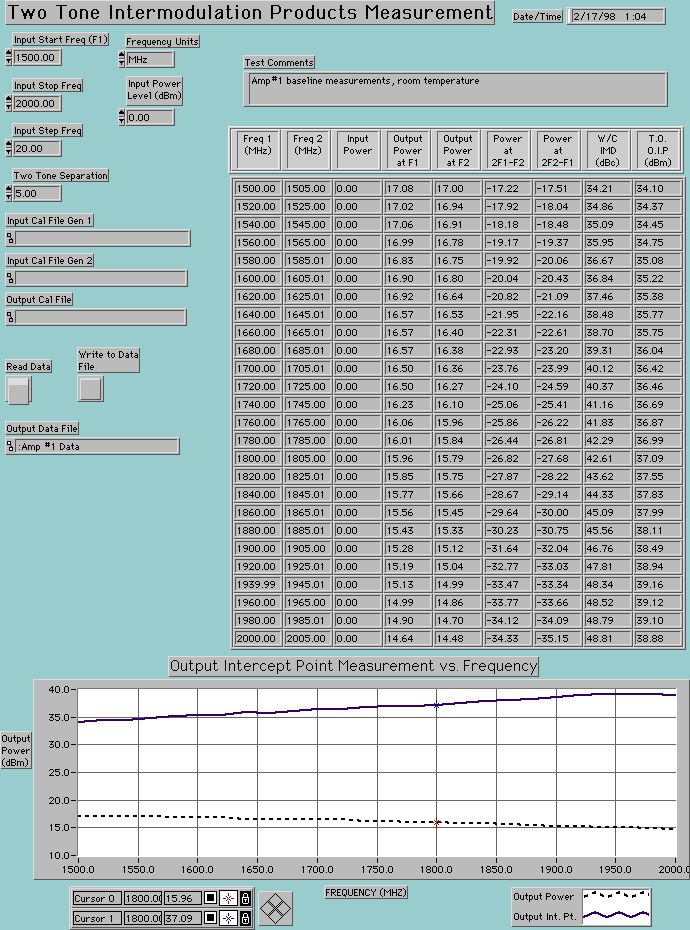
Two Tone Third Order Output Intercept Point Measurements
Two Tone Third Order Output Intercept Point Measurements

This LabVIEW panel shows the results of computer automated Two-Tone Third Order Output Intercept Point measurements for a PCS band RF amplifier. Measurements were performed using two programmable signal generators and a spectrum analyzer. A power meter was used to calibrate the input and output cables and connectors, and the spectrum analyzer amplitude readings. This panel design is tailored toward an "engineering evaluation" environment, instead of a "production test" environment.
Edited on: Thursday, July 20, 2006 4:41 PM
Categories: 70 LabVIEW Examples-Archive
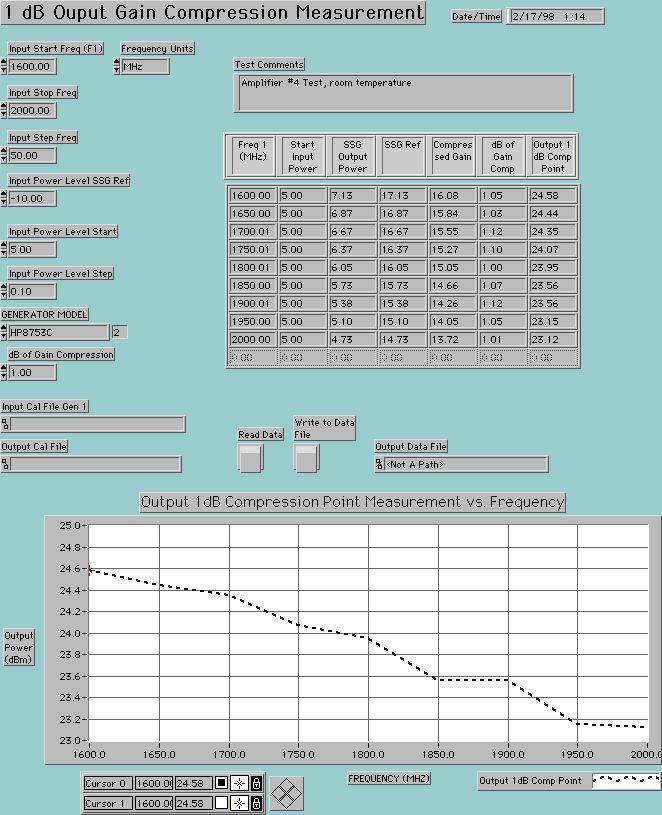
1 dB Output Gain Compression Point Measurements
1 dB Output Gain Compression Point Measurements

This LabVIEW panel shows the results of a computer automated 1 dB Output Gain Compression Point measurements for a PCS band RF amplifier. Measurements were performed using a programmable signal generator and a spectrum analyzer. A power meter was used to calibrate the input and output cables and connectors, and the spectrum analyzer amplitude readings. This panel design is tailored toward an "engineering evaluation" environment, instead of a "production test" environment. This is just one example of the types of automated RF measurements that can be performed using LabVIEW.
Edited on: Thursday, July 20, 2006 4:41 PM
Categories: 70 LabVIEW Examples-Archive
Thursday, February 05, 1998
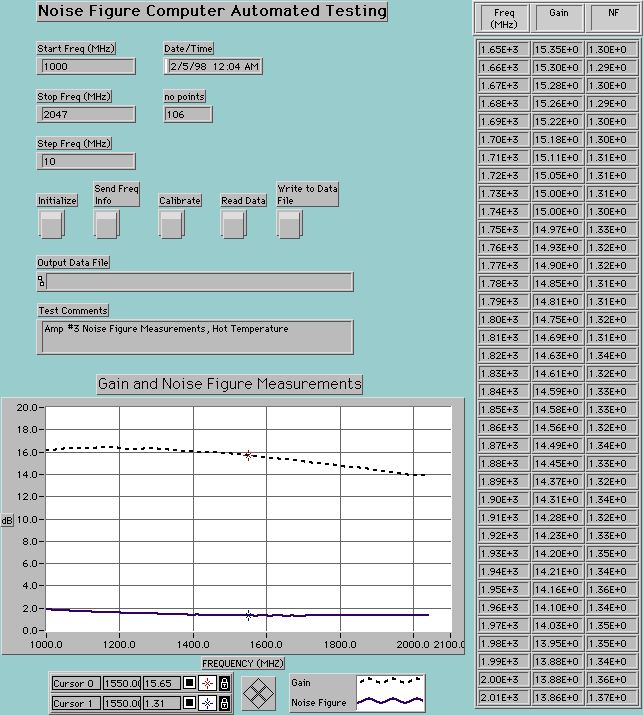
Computer Automated Noise Figure Measurements
LabVIEW Example - Computer Automated Noise Figure Measurements

This LabVIEW panel shows the results of computer automated Noise Figure measurements for a PCS band RF amplifier. Measurements were performed using a HP-8970B Noise Figure Meter. This panel design is tailored toward an "engineering evaluation" environment, compared to a "production test" environment. This is just one example of the types of automated RF measurements that can be performed using LabVIEW.
Edited on: Thursday, July 20, 2006 4:40 PM
Categories: 70 LabVIEW Examples-Archive
Sunday, February 01, 1998
Cryogenic Cooled RF Amplifier Development for PCS Application
Cryogenic Cooled RF Amplifier Development for PCS Application
-
We helped a company involved in Cryogenic packaging to design, verify
and test a cryogenic cooled LNA package. We used LabVIEW software to
develop a complete computer automated test station, providing the
following measurements controlled by LabVIEW via GPIB interfaces:
- Full 2-Port S-Parameters
- Noise Figure vs. Frequency
- 1 dB Output Compression Point vs Frequency
- Two Tone Third Order Output Intercept Point vs Frequency
-
The test setup was designed so that a lot of detailed testing could be
completed in a very short time (while the device was in a vacuum and
being cooled with liquid Nitrogen. The test equipment being controlled
included:
- HP Network Analyzer
- HP Noise Figure Meter
- HP Power Meter
- HP Signal Generator
- HP Spectrum Analyzer
- All measured data was stored electronically in electronic format for importing into spreadsheet programs for further analysis and plotting of results.....
Edited on: Sunday, October 06, 2013 12:00 PM
Categories: 70 LabVIEW Examples-Archive, 80 Consulting Examples-Archive