Saturday, August 11, 1990
Instantaneous Frequency Measurement (IFM)
LabVIEW Example - Instantaneous Frequency Measurement (IFM)

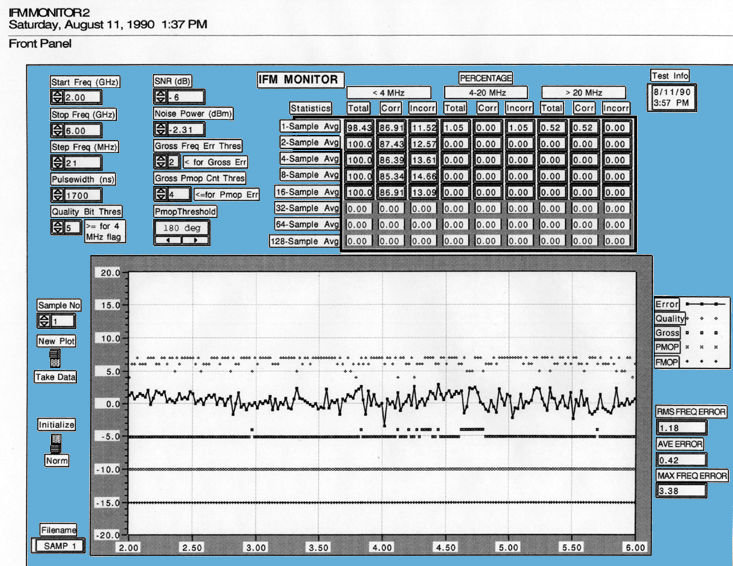
2. Explanation of Parameters on Data Plots
An explanation of the parameters on the data plots shown in Appendix A is provided below.
2.1. Start, Stop and Step Frequencies
Frequencies used for test data.
2.2. Noise Power (dBm)
The wideband noise power across the 2 to 6 GHz frequency band. The noise source was provided by cascading several 2-6 GHz amplifiers together and tuning the amps for flat gain across the frequency band. The noise power was measured using a broadband power meter.
In the NB filter measurements, the noise power represents the noise power across the NB filter bandwidth measured using a broadband power meter.
2.3. SNR
The Signal to Noise Ratio at the IFM input. The SNR was achieved by combining the signal and noise and adjusting the input RF signal relative to the wideband noise power measured.
2.4. Pulsewidth (nSec)
The pulsewidth of the IFM enable (Freq Strobe). The pulsewidth determines how many samples are received from the IFM at each frequency. There will be 1 frequency reading or average frequency output every 100 nSec over the IFM enable time
2.5. Data < 4 MHz
The percentage of frequency readings that were less than 4 MHz error were calculated. The readings were flagged correctly if the Gross Freq Error Flag was 0, and the PMOP Freq Error Flag was 0, and the Quality Bits were greater than or equal to the Quality Bit Threshold. The readings were flagged incorrectly if the Gross Freq Error Flag was 1, or the PMOP Freq Error Flag was 1, or the Quality Bits were less than the Quality Bit Threshold. Percentages of data flagged correctly and incorrectly were summarized.
2.6. Data 4 - 20 MHz
The percentage of frequency readings that were between 4 and 20 MHz error were calculated. The readings were flagged correctly if the Gross Freq Error Flag was 0, and the PMOP Freq Error Flag was 0, and the Quality Bits were less than the Quality Bit Threshold. The readings were flagged incorrectly if the Gross Freq Error Flag was 1, or the PMOP Freq Error Flag was 1, or the Quality Bits were greater than or equal to the Quality Bit Threshold. Percentages of data flagged correctly and incorrectly were summarized.
2.7. Data > 20 MHz
The percentage of frequency readings that were> 20 MHz error were calculated. The readings were flagged correctly if the Gross Freq Error Flag was 1, or the PMOP Freq Error Flag was 1. The readings were flagged incorrectly if the Gross Freq Error Flag was 0, and the PMOP Freq Error Flag was 0. Percentages of data flagged correctly and incorrectly were summarized.
2.8. Quality Bit Threshold
The three quality bits comparing the last two correlator channels is an output of the IFM with each frequency reading. A seven (111) represents high correlation, and 0 (000) represents poor correlation between the correlator channels. The quality bits were compared against the Quality Bit Threshold to flag frequency readings in the range 4 to 20 MHz error. If the quality bits were less than the Quality Bit Threshold, and the Gross Freq Error and PMOP Freq Error were at logic 0, then the data would be flagged as a fine frequency error (4 - 20 MHz).
2.9. Gross Freq Error Threshold
The Gross Freq Error Threshold was programmed as an input to the IFM. If the worst case of all the correlator compares in the IFM is less than the Gross Freq Error Threshold, then the Gross Freq Error Flag is set to logic 1. The Gross Freq Error Flag is used to flagged errors > 20 MHz. See Appendix B for further information.
2.10. Gross PMOP Count Threshold
The Gross PMOP Count Threshold represents the number of IFM samples where the PMOP flag was looked at to determine low SNR conditions. If the the PMOP Flag was logic 1 at or before the Gross PMOP Count Threshold (no. of samples), then the PMOP Freq Error Flag would be set to logic 1. The PMOP Freq Error Flag is used to flag errors > 20 MHz. See Appendix B for further information.
2.11. PMOP Threshold
The type of phase modulation being detected (90° / 180°).
2.12. Sample No.
The plot shows results for the Sample No. on the left side of the plot. Note: the software program starts all arrays with element "0". Therefore, Sample 0 corresponds to the first frequency reading, Sample 1 corresponds to the second frequency average, etc.
2.13. Data Plots
The data plots on each page show test results for the Sample No. shown. The top trace shows the Quality Bits for each frequency reading. a 7 (111) represents good quality and 0 (000) represents poor quality.
The second trace shows the frequency error across the frequency band (MHz)
The third trace shows the Gross Freq Error Flag for each frequency reading. The trace is offset at -5 for clarity. When the value is -5, the flag is logic 0. When the value is -4, the flag is logic 1.
The fourth trace is the PMOP Freq Error Flag. If the PMOP flag is logic 1 in less than the Gross PMOP Count Threshold sample no, the PMOP Freq Error Flag is set to Logic 1. This trace is offset at -10 for clarity.
The fifth trace is the FMOP Flag, offset at -15 for clarity.
Edited on: Thursday, July 20, 2006 4:39 PM
Categories: 70 LabVIEW Examples-Archive