Tuesday, September 29, 2009
R. A. Wood Associates awarded contract from NSWC Crane Division
|
R. A. Wood Associates has been awarded a contract from Naval Surface Warfare Center (NSWC), Crane Division. The contract involves designing and delivering an automated test rack consisting of:
We are fortunate to be able to work with Viewpoint Systems on this contract.
This contract was won on a competitive bid, and our solution was selected out of many other submissions. We are very excited about the opportunity to work with NSWC Crane Division! |

|
Edited on: Tuesday, October 08, 2013 5:10 PM
Categories: 60 Hardware Products-Archive, 70 LabVIEW Examples-Archive, 80 Consulting Examples-Archive
Sunday, February 25, 2007
Demo Version of RFSpecTest Released
Hello Fellow Test Engineers and Managers:
- Are you frustrated with the time and effort required to test your RF and microwave components?
- Are you upset with the errors and mistakes associated with manual testing?
- Is developing your own computer automated test software beyond your budget?
- Do you already have test equipment capable of GPIB control?
- 1, 2, or 3 RF Signal Generators?
- A Spectrum Analyzer?
- An RF Power Meter?
- Wouldn't it be great if there was a software program already developed that could be used right away to start making automated RF measurements?
We have a software program, called RFSpecTest, which has many built-in computer automated RF/microwave tests already developed. We've just created a demonstration version that can be downloaded and evaluated. More information is available from our software information page. Download the demo, and try out the tests and interfaces available. We also have some sample measurement files you can load into the program. Give it a try and let us know what you think!
Thanks! Bob WoodEdited on: Sunday, February 25, 2007 2:35 AM
Categories: 35 Software Products-Current, 70 LabVIEW Examples-Archive
Friday, September 15, 2006
New Integrated RF Test Rack Designed and Delivered
|
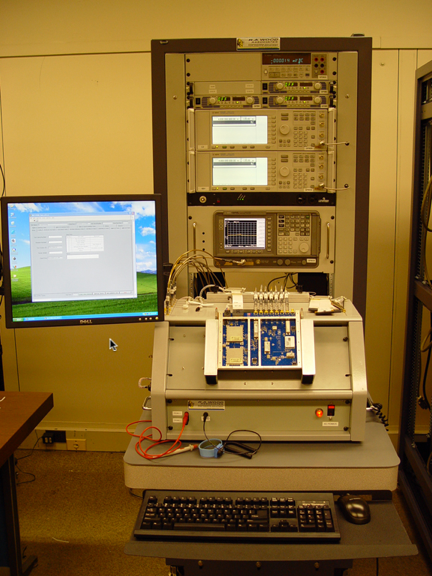
On September 15 2006, R. A. Wood Associates delivered the first two of 15 complete Integrated RF Test Racks. The Integrated RF Test Rack provided a complete solution for complete automated testing of 7 RF/Digital modules. All equipment was controlled through GPIB interfaces. All automated test software was written in National Instruments LabVIEW by R. A. Wood Associates. RFSpecTest was used in "script" mode to perform most of the RF measurements. The rack consisted of:
The full rack was designed to be a comfortable testing environment, as well as easy to maintain. Equipment is easy to remove if needed with minimal interference to other equipment. More information about the Integrated RF Test Rack is available from this link. |
Edited on: Monday, August 21, 2023 6:00 PM
Categories: 60 Hardware Products-Archive, 70 LabVIEW Examples-Archive, 80 Consulting Examples-Archive, 95 Other-Archive
Friday, December 02, 2005
New Computer Automated RF Test Station developed and delivered
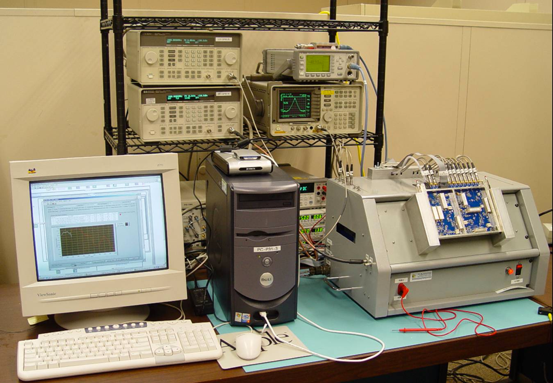
| We designed and developed a Computer Automated RF Test Station for one of our customers. The Computer Automated RF Test Station is capable of testing 7 different RF and RF/digital modules, but is flexible enough to test many possible RF modules. The Test Stations were built and tested at R. A. Wood Associates. Computer automated test software was also developed to test the 7 different modules using LabVIEW. RFSpecTest was used in a "scripted" mode to perform all RF tests. More information about the Computer Automated RF Test Station is available at this link. |
|
Edited on: Tuesday, October 08, 2013 4:53 PM
Categories: 60 Hardware Products-Archive, 70 LabVIEW Examples-Archive, 80 Consulting Examples-Archive
Tuesday, October 12, 2004
RF Path Analysis Toolkit Coming Soon
We are very close to releasing a "stable" beta version of our RF Path Analysis Toolkit environment. This will allow engineers to create RF path (cascade) analysis spreadsheets to analyze their RF and microwave designs. The program uses library files, RF path files, and template spreadsheets within a LabVIEW user interface to create an full RF path analysis environment. Please stop by again soon to download and try out this new software package.Edited on: Monday, October 07, 2013 7:37 PM
Categories: 70 LabVIEW Examples-Archive
Monday, May 24, 2004
We've uploaded a correction to PathLossSolver (Version 1.1h)
Some people had trouble installing PathLossSolver on their computer. We've added a revised version (1.1h) of the program that should be easier to install. Go to our software download page for the latest updates. Thanks for your patience!Edited on: Monday, October 07, 2013 7:37 PM
Categories: 70 LabVIEW Examples-Archive
Friday, March 26, 2004
We've released an upgrade to SpurFinder (Version 3.1g)
We've added a few improvements to SpurFinder Version 3.1g. Some of the improvements are:- In the demo version, the LO can now be adjusted to 16.0 +/-0.25, which will allow the user to see some of the input and output frequency tracking features
- The "Sliding Input Frequencies, Fixed Output Frequencies" and "Fixed Input Frequencies, Sliding Output Frequencies" controls now work for both up and down conversions, high and low side LO's (all combinations)
- The filename for the current spur scenario is displayed on the front panel for better documentation of results
- This is a free upgrade to users of Version 3.0 and above
Edited on: Monday, October 07, 2013 7:36 PM
Categories: 70 LabVIEW Examples-Archive
Wednesday, February 18, 2004
Fonts updated in all software programs (Windows XP users)
For some Windows XP users, the fonts used in our software programs were not available in Windows XP, causing the front panel fonts to be substituted with other fonts. This caused some displays to become overcrowded. The newer versions use a font that is available in all Windows versions. You can download the newer versions if you have had trouble with the front panel display fonts. Go to our software download page for the latest updatesEdited on: Sunday, October 06, 2013 12:10 PM
Categories: 70 LabVIEW Examples-Archive
Tuesday, June 10, 2003
R. A. Wood Associates at MTT Symposium
R. A. Wood Associates demonstrated our RFSpecTest software product at MTT Symposium in Philadelphia, PA during June 10-12, 2003. See our Press Release for more info.Edited on: Sunday, October 06, 2013 12:10 PM
Categories: 70 LabVIEW Examples-Archive, 80 Consulting Examples-Archive
Tuesday, March 18, 2003
New Software Releases with integrated payment and registration!
We've updated our software products to improve the payment and registration process. You can now pay for registration directly through PayPal, E-mail, or using a WWW form. This feature is built in to the software programs. The User Name and Registration Key are sent to us electronically. After payment is confirmed, we will send you a Registration Number electronically via E-mail. This should make the whole payment and registration process smoother and simpler.Edited on: Sunday, October 06, 2013 12:09 PM
Categories: 70 LabVIEW Examples-Archive
Monday, August 12, 2002
R. A. Wood Associates Demonstrated Computer Automated RF Test Software Suite at NI Week Aug 13-16, 2002 in Austin, Texas:
R. A. Wood Associates introduced their latest computer automated RF test software suite, RFSpecTest, at National Instruments (NI) Week, August 13-16. See Press release. The test software suite is centered around NI's latest RF product, the NI 5660 Spectrum Analyzer. Automated testing for gain, two tone intermodulation products, gain compression, relative measurements, and others was demonstrated for amplifiers, mixers, switches, filters, attenuators, RF integrated circuits and more. Thanks to all who stopped by to see our new product! A picture of our booth and computer automated test setup at NI Week. For an overview of the of RFSpecTest, select this link (1.7 MB pdf file).Edited on: Sunday, October 06, 2013 12:06 PM
Categories: 70 LabVIEW Examples-Archive, 80 Consulting Examples-Archive
Tuesday, June 11, 2002
TunerHelper Version 2.1e for PC is now available
Version 2.1e adds new features, including:- The capability to analyze and predict spurious products up to 20R X 20L order
- Increased efficiency of program, spurious products are calculated and plotted up to 50% faster
- Added Cancel Button to Preselection Filter, Mixer, and Post Selection Filter panels
- Moved save and open commands to the File Menu.
Edited on: Monday, October 07, 2013 7:34 PM
Categories: 70 LabVIEW Examples-Archive
SpurFinder Version 3.1e for PC is now available
Version 3.1e adds new features, including:- The capability to view spurious products up to 20R X 20L order
- Added "Conversion Mode" selection to allow input or output frequencies to "slide" with LO frequency
- "Sliding Input Frequencies" - Used for fixed IF down conversions or
- "Sliding Output Frequencies" - Used for fixed input up conversions
- Moved save and open commands to the File Menu.
Edited on: Monday, October 07, 2013 7:35 PM
Categories: 70 LabVIEW Examples-Archive
Saturday, June 01, 2002
Upgrade and Repair Services
Upgrade and Repair Services
-
One of our clients had received some RF modules that were functionally
working, but the performance was not meeting system performance
requirements. We analyzed the modules, determined the changes needed
to meet system performance requirements, and upgraded the RF modules
for our customer. Some of the highlights of this effort:
- New RF components were specified, sent out for quotes, and purchased from vendors
- Improved 1 dB compression points
- Reduced noise power levels
- Improved P-P flatness
- Automated RF test software was developed to perform final acceptance tests
- Acceptance test reports were created and delivered to the customer for each upgraded RF module
- Some of the modules were RF components interconnected with coaxial RF cables
- Some of the modules were surface mount components on microstrip medium
- The system performance was greatly enhanced by these upgraded RF modules
Edited on: Sunday, October 06, 2013 12:06 PM
Categories: 70 LabVIEW Examples-Archive, 80 Consulting Examples-Archive
Monday, April 01, 2002
MetalTest Systems available
We have developed a computer automated Metal Tester for testing metals using thermo-electric measurements from an Acromag meter, a PC A/D converter board, and LabVIEW software. For more information, go to this page.
Edited on: Sunday, October 06, 2013 12:05 PM
Categories: 70 LabVIEW Examples-Archive, 80 Consulting Examples-Archive
Friday, June 01, 2001
Computer Automated Test System for LDMOS Wireless RF Power Amplifiers
Computer Automated Test System for LDMOS Wireless RF Power Amplifiers
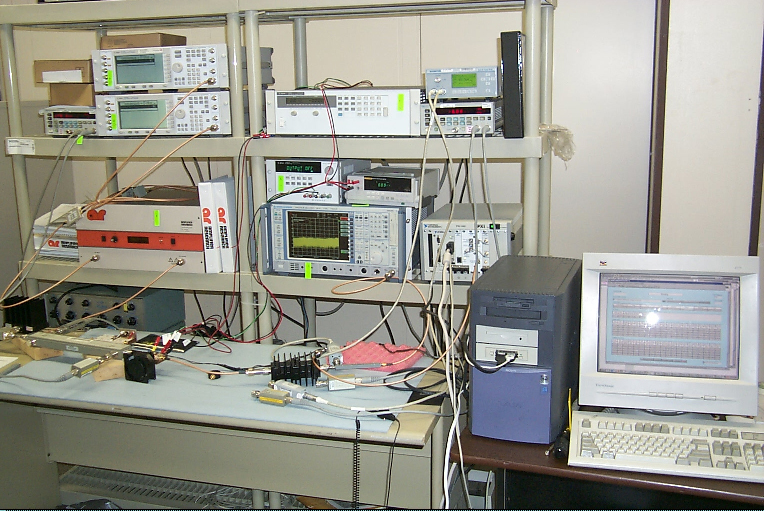
- We provided an automated RF Test System to provide computer automated testing of LDMOS RF Power Amplifiers. The amplifiers are used in base stations for AMPS, PCS, UMTS systems. Software was developed using National Instruments LabVIEW
-
RF Measurements provided at several Output Power Levels
- Gain
- Gain Compression (servoed to X dB gain compression)
- Output Power (servoed to a specified power)
- Intermodulation Products (IMD)
- Adjacent Channel Power (ACP)
- Return Loss
-
DC Measurements included:
- IDQ Servo (Adjust Vgg to achieve desired Idd current)
- Idd measurement at RF Output Power
- Ronq
- Ronh
- Gmq
- Gmh
-
Other Measurements
- Efficiency
- Power Added Efficiency (PAE)
- For an overview presentation of the LDMOS Automated Test System:
Edited on: Sunday, October 06, 2013 12:03 PM
Categories: 70 LabVIEW Examples-Archive, 80 Consulting Examples-Archive
Sunday, November 01, 1998
MetalTest Software
MetalTest Software
A software program was developed using LabVIEW, a graphical programming language from National Instruments. The program runs on a PC and is connected to an Acromag Metal Tester using a PC Data Acquisition board. The program compares the readings gathered from the Metal Tester to readings in a database for various alloys. The program then gave a readout of what metal alloy most closely coincided with the metal being tested. The program also provided probability levels (T-Test) to show confidences against the various other possible alloys in the database. The MetalTest System is currently being used to recycle aircraft engine machining scrap and is helping the company earn hundreds of thousands of dollars in metal reclamation sales.
Click here for more information!
Edited on: Sunday, October 06, 2013 12:02 PM
Categories: 70 LabVIEW Examples-Archive, 80 Consulting Examples-Archive
Saturday, August 01, 1998
IF Receiver/Digitizer
Engineering Consulting Examples: IF Receiver/Digitizer
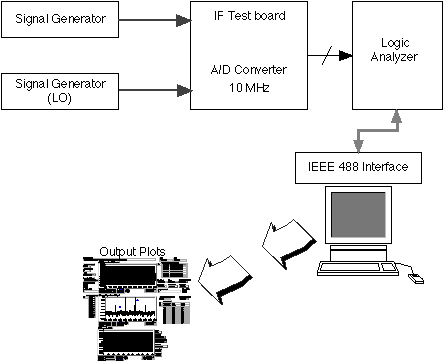
Software was developed to retrieve the binary data from a IF Receiver/Digitizer board. The board design utilized a 10 MHz A/D converter to sample the IF signal. A Logic Analyzer attached to the board captured the digital data from the IF Receiver/Digitizer board. The computer used an IEEE-488 interface to connect to the Logic Analyzer and retrieve the values. After the binary data was retrieved, converted, and stored in an array, the data could be graphed and analyzed. The arrays were converted to a series of voltage values of the incoming signal. The voltages were plotted and then recorded. The data was then used in signal frequency and noise analysis. The Fast Fourier Tranform was used to determine the spectral content of the sampled signals. The FFT of the digital signal could then be compared to the Power Spectrum Analyzer data of the analog signal. The software was developed using National Instruments LabVIEW graphical programming language. The measured data could be stored to a data file to record that particular test.
- Click here to see display panel showing A/D Noise Floor Measurement
- Click here to see display panel showing A/D Measurement of 4 MHz Signal
- Click here to see display panel showing A/D Measurement of 17 MHz Signal
Edited on: Monday, October 07, 2013 7:33 PM
Categories: 70 LabVIEW Examples-Archive, 80 Consulting Examples-Archive
Tuesday, February 17, 1998
Two Tone Third Order Output Intercept Point Measurements
Two Tone Third Order Output Intercept Point Measurements
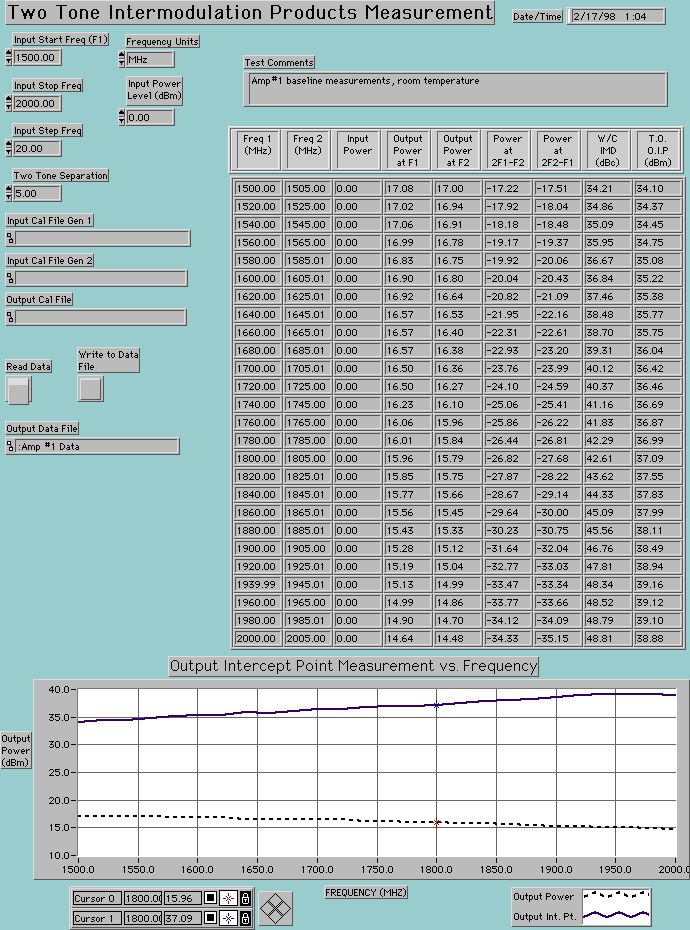
This LabVIEW panel shows the results of computer automated Two-Tone Third Order Output Intercept Point measurements for a PCS band RF amplifier. Measurements were performed using two programmable signal generators and a spectrum analyzer. A power meter was used to calibrate the input and output cables and connectors, and the spectrum analyzer amplitude readings. This panel design is tailored toward an "engineering evaluation" environment, instead of a "production test" environment.
Edited on: Thursday, July 20, 2006 4:41 PM
Categories: 70 LabVIEW Examples-Archive
1 dB Output Gain Compression Point Measurements
1 dB Output Gain Compression Point Measurements
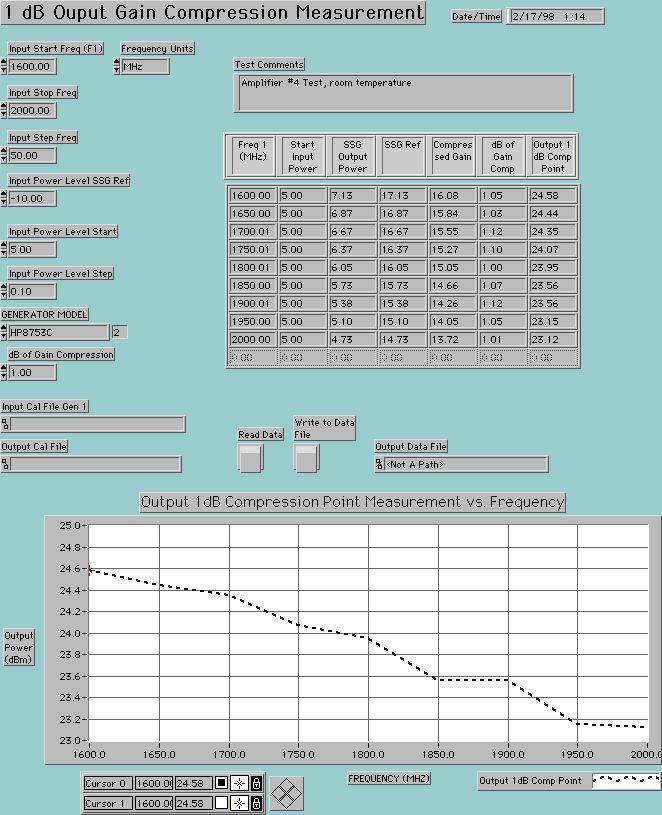
This LabVIEW panel shows the results of a computer automated 1 dB Output Gain Compression Point measurements for a PCS band RF amplifier. Measurements were performed using a programmable signal generator and a spectrum analyzer. A power meter was used to calibrate the input and output cables and connectors, and the spectrum analyzer amplitude readings. This panel design is tailored toward an "engineering evaluation" environment, instead of a "production test" environment. This is just one example of the types of automated RF measurements that can be performed using LabVIEW.
Edited on: Thursday, July 20, 2006 4:41 PM
Categories: 70 LabVIEW Examples-Archive
Thursday, February 05, 1998
Computer Automated Noise Figure Measurements
LabVIEW Example - Computer Automated Noise Figure Measurements
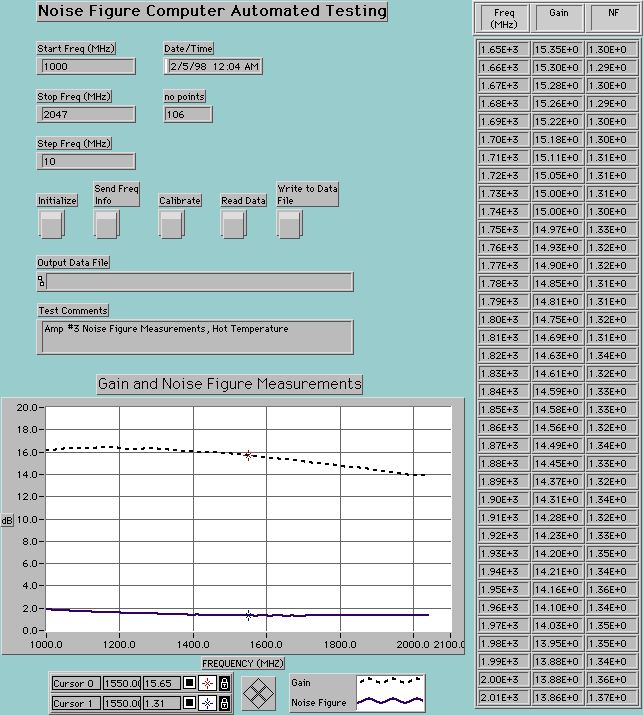
This LabVIEW panel shows the results of computer automated Noise Figure measurements for a PCS band RF amplifier. Measurements were performed using a HP-8970B Noise Figure Meter. This panel design is tailored toward an "engineering evaluation" environment, compared to a "production test" environment. This is just one example of the types of automated RF measurements that can be performed using LabVIEW.
Edited on: Thursday, July 20, 2006 4:40 PM
Categories: 70 LabVIEW Examples-Archive
Sunday, February 01, 1998
Cryogenic Cooled RF Amplifier Development for PCS Application
Cryogenic Cooled RF Amplifier Development for PCS Application
-
We helped a company involved in Cryogenic packaging to design, verify
and test a cryogenic cooled LNA package. We used LabVIEW software to
develop a complete computer automated test station, providing the
following measurements controlled by LabVIEW via GPIB interfaces:
- Full 2-Port S-Parameters
- Noise Figure vs. Frequency
- 1 dB Output Compression Point vs Frequency
- Two Tone Third Order Output Intercept Point vs Frequency
-
The test setup was designed so that a lot of detailed testing could be
completed in a very short time (while the device was in a vacuum and
being cooled with liquid Nitrogen. The test equipment being controlled
included:
- HP Network Analyzer
- HP Noise Figure Meter
- HP Power Meter
- HP Signal Generator
- HP Spectrum Analyzer
- All measured data was stored electronically in electronic format for importing into spreadsheet programs for further analysis and plotting of results.....
Edited on: Sunday, October 06, 2013 12:00 PM
Categories: 70 LabVIEW Examples-Archive, 80 Consulting Examples-Archive
Saturday, June 21, 1997
Software Controlled Laser Power Meter Interface
Software Controlled Laser Power Meter Interface
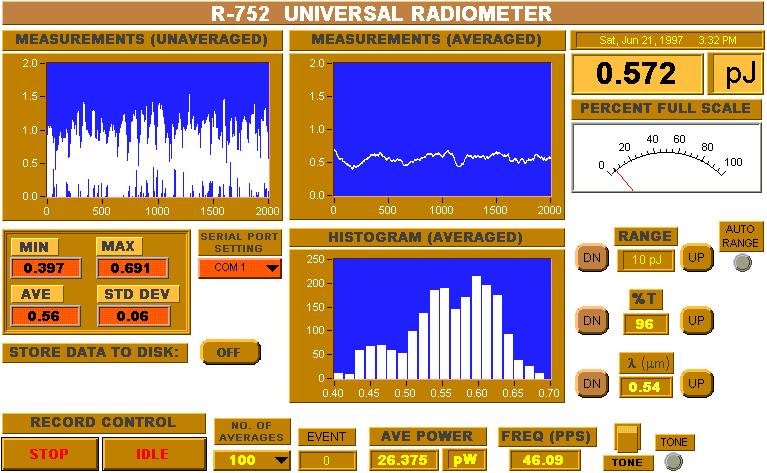
- Software was developed to provide a computer-controlled interface to a Universal Radiometer. The Universal Radiometer is a piece of test equipment used to measure laser power. The device was controlled by a PC serial port. The software was developed using National Instruments LabVIEW graphical programming language.
- All instrument controls are sent from the screen display through the PC serial port to the test equipment.
- Data from the test equipment is sent via the PC serial port to the computer and analyzed and displayed on the screen display.
- Measured data can be stored to an external file in Microsoft Excel or other spreadsheet compatible format.
- Measurement statistics are calculated and displayed in real time
Edited on: Thursday, July 20, 2006 4:38 PM
Categories: 70 LabVIEW Examples-Archive, 80 Consulting Examples-Archive
Sunday, January 01, 1995
Spectrum Analyzer Instrument Driver
LabVIEW Example - Spectrum Analyzer Instrument Driver
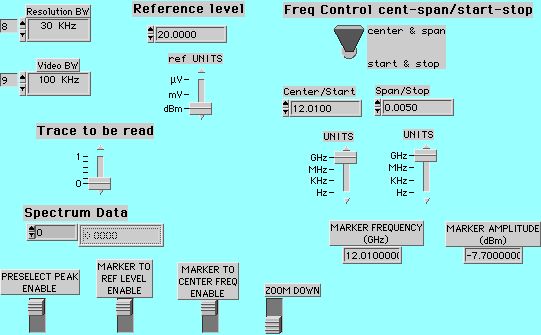
This LabVIEW panel shows an software controlled instrument driver that is utilized for HP Spectrum Analyzers. The software has been used on HP-8566B and HP-8593E Series Spectrum Analyzers. All front panel controls are translated to GPIB commands to control the equipment over a GPIB interface. The output readings are Marker Frequency and Marker Amplitude. Various options are included for locating and finding RF signals.
Edited on: Monday, August 14, 2006 2:25 AM
Categories: 70 LabVIEW Examples-Archive
Tuning Station Example (Audible Feedback)
Tuning Station Example (Audible Feedback)
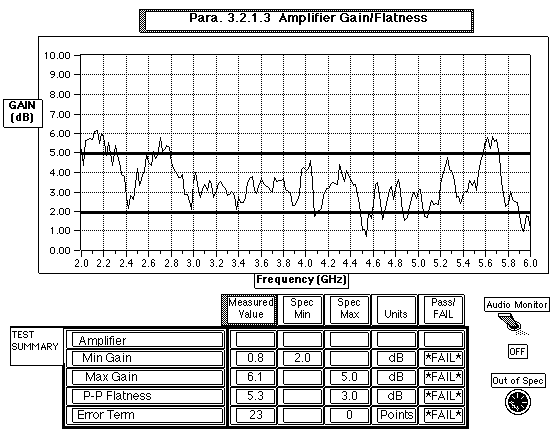
In this example an amplifier tuning station provides audible feedback to aid the technician in tuning the amplifier within its specified performance limits. The technician can tune the amplifier under a microscope, using the audio tones to indicate how close the device meets its specified performance window. The technician does not have to look up from his work to check an instrument panel to determine the results of his/her tuning.
R. A. Wood Associates can custom develop automated test software for your particular needs in your test station. We can provide and implement ideas to enhance your productivity.
Edited on: Monday, August 14, 2006 2:24 AM
Categories: 70 LabVIEW Examples-Archive
Statistical Data Reduction and Analysis
Statistical Data Reduction and Analysis
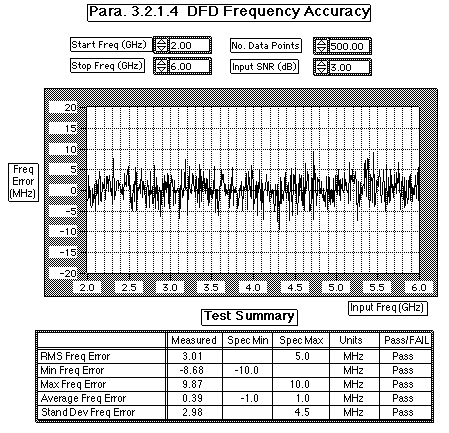
R. A. Wood Associates Software can save valuable test and debug time by analyzing and summarizing large quantities of data. This example shows the result of taking 500 frequency readings from a Digital Frequency Discriminator (DFD) under low signal to noise ratio conditions. The DFD frequency error is plotted on the graph vs input frequency. The statistics of the frequency error are evaluated in the Test Summary and compared against the specifications. The test operator obtains immediate feedback from the results of the measurements.
Edited on: Monday, August 14, 2006 2:24 AM
Categories: 70 LabVIEW Examples-Archive
User Friendly Test System Interface
User Friendly Test System Interface
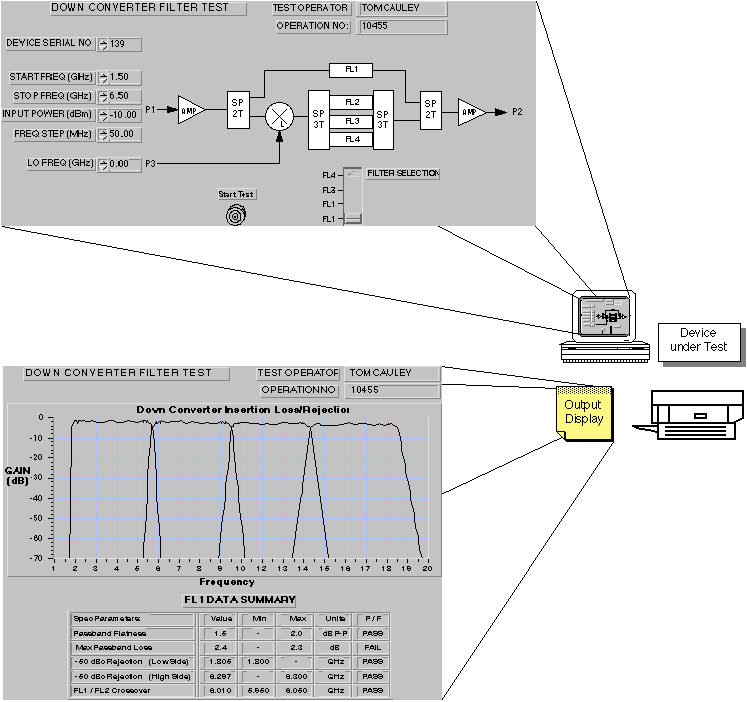
The LabVIEW software developed by R. A. Wood Associates provides a user friendly interface to the automated test setup. The computer screen is the Test Panel, where input test parameters are entered or selected. Selection switches can be placed on the screen to control the hardware being tested.
After the test is completed, the output data is summarized, plotted, and printed out. Actual test data points can be stored in data files if needed.
Edited on: Monday, August 14, 2006 2:24 AM
Categories: 70 LabVIEW Examples-Archive
Typical Automated Test Setup (Microwave Test)
Typical Automated Test Setup (Microwave Test)
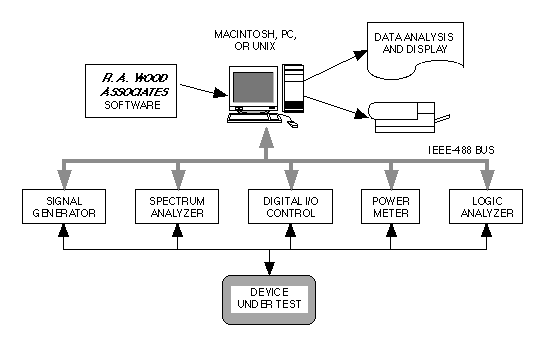
This diagram shows a typical computer automated test setup. In this application, a microwave device is tested using microwave test equipment such as the signal generator, spectrum analyzer, and power meter. The digital I/O controller provides the logic controls for the Device Under Test while the logic analyzer reads digital information from the device.
The computer acts as the automated test controller. It controls the microwave test equipment to provide stimulus and measurements to and from the Device Under Test. Digital control is passed from the computer through the digital I/O board. Digital output data is passed from the logic analyzer to the computer.
The R. A. Wood Associates software will control the testing and analyze the measurements. Typical measurements may include gain, noise figure, gain compression, spurious signals, filter rejection and amplitude accuracy. The measured data is then summarized, eliminating the need for manual data reduction. Output data can be stored in data files for further analysis and evaluation.
Edited on: Monday, August 14, 2006 2:25 AM
Categories: 70 LabVIEW Examples-Archive
Saturday, August 11, 1990
Instantaneous Frequency Measurement (IFM)
LabVIEW Example - Instantaneous Frequency Measurement (IFM)
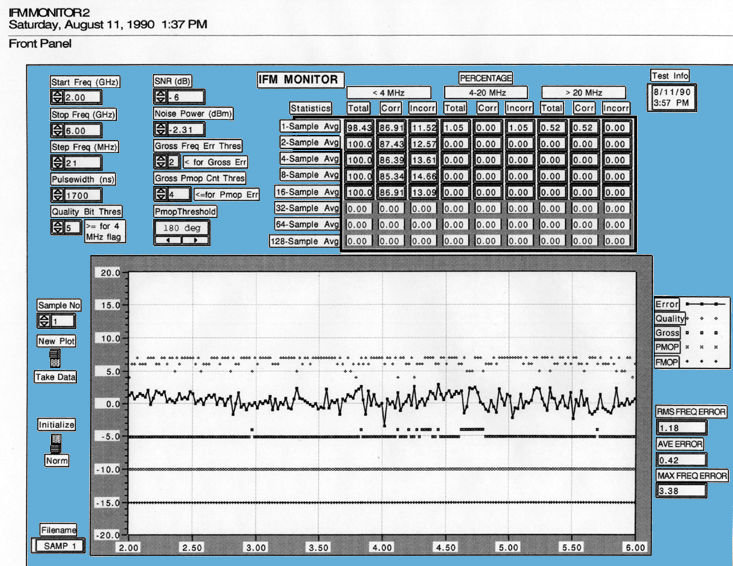
2. Explanation of Parameters on Data Plots
An explanation of the parameters on the data plots shown in Appendix A is provided below.
2.1. Start, Stop and Step Frequencies
Frequencies used for test data.
2.2. Noise Power (dBm)
The wideband noise power across the 2 to 6 GHz frequency band. The noise source was provided by cascading several 2-6 GHz amplifiers together and tuning the amps for flat gain across the frequency band. The noise power was measured using a broadband power meter.
In the NB filter measurements, the noise power represents the noise power across the NB filter bandwidth measured using a broadband power meter.
2.3. SNR
The Signal to Noise Ratio at the IFM input. The SNR was achieved by combining the signal and noise and adjusting the input RF signal relative to the wideband noise power measured.
2.4. Pulsewidth (nSec)
The pulsewidth of the IFM enable (Freq Strobe). The pulsewidth determines how many samples are received from the IFM at each frequency. There will be 1 frequency reading or average frequency output every 100 nSec over the IFM enable time
2.5. Data < 4 MHz
The percentage of frequency readings that were less than 4 MHz error were calculated. The readings were flagged correctly if the Gross Freq Error Flag was 0, and the PMOP Freq Error Flag was 0, and the Quality Bits were greater than or equal to the Quality Bit Threshold. The readings were flagged incorrectly if the Gross Freq Error Flag was 1, or the PMOP Freq Error Flag was 1, or the Quality Bits were less than the Quality Bit Threshold. Percentages of data flagged correctly and incorrectly were summarized.
2.6. Data 4 - 20 MHz
The percentage of frequency readings that were between 4 and 20 MHz error were calculated. The readings were flagged correctly if the Gross Freq Error Flag was 0, and the PMOP Freq Error Flag was 0, and the Quality Bits were less than the Quality Bit Threshold. The readings were flagged incorrectly if the Gross Freq Error Flag was 1, or the PMOP Freq Error Flag was 1, or the Quality Bits were greater than or equal to the Quality Bit Threshold. Percentages of data flagged correctly and incorrectly were summarized.
2.7. Data > 20 MHz
The percentage of frequency readings that were> 20 MHz error were calculated. The readings were flagged correctly if the Gross Freq Error Flag was 1, or the PMOP Freq Error Flag was 1. The readings were flagged incorrectly if the Gross Freq Error Flag was 0, and the PMOP Freq Error Flag was 0. Percentages of data flagged correctly and incorrectly were summarized.
2.8. Quality Bit Threshold
The three quality bits comparing the last two correlator channels is an output of the IFM with each frequency reading. A seven (111) represents high correlation, and 0 (000) represents poor correlation between the correlator channels. The quality bits were compared against the Quality Bit Threshold to flag frequency readings in the range 4 to 20 MHz error. If the quality bits were less than the Quality Bit Threshold, and the Gross Freq Error and PMOP Freq Error were at logic 0, then the data would be flagged as a fine frequency error (4 - 20 MHz).
2.9. Gross Freq Error Threshold
The Gross Freq Error Threshold was programmed as an input to the IFM. If the worst case of all the correlator compares in the IFM is less than the Gross Freq Error Threshold, then the Gross Freq Error Flag is set to logic 1. The Gross Freq Error Flag is used to flagged errors > 20 MHz. See Appendix B for further information.
2.10. Gross PMOP Count Threshold
The Gross PMOP Count Threshold represents the number of IFM samples where the PMOP flag was looked at to determine low SNR conditions. If the the PMOP Flag was logic 1 at or before the Gross PMOP Count Threshold (no. of samples), then the PMOP Freq Error Flag would be set to logic 1. The PMOP Freq Error Flag is used to flag errors > 20 MHz. See Appendix B for further information.
2.11. PMOP Threshold
The type of phase modulation being detected (90° / 180°).
2.12. Sample No.
The plot shows results for the Sample No. on the left side of the plot. Note: the software program starts all arrays with element "0". Therefore, Sample 0 corresponds to the first frequency reading, Sample 1 corresponds to the second frequency average, etc.
2.13. Data Plots
The data plots on each page show test results for the Sample No. shown. The top trace shows the Quality Bits for each frequency reading. a 7 (111) represents good quality and 0 (000) represents poor quality.
The second trace shows the frequency error across the frequency band (MHz)
The third trace shows the Gross Freq Error Flag for each frequency reading. The trace is offset at -5 for clarity. When the value is -5, the flag is logic 0. When the value is -4, the flag is logic 1.
The fourth trace is the PMOP Freq Error Flag. If the PMOP flag is logic 1 in less than the Gross PMOP Count Threshold sample no, the PMOP Freq Error Flag is set to Logic 1. This trace is offset at -10 for clarity.
The fifth trace is the FMOP Flag, offset at -15 for clarity.
Edited on: Thursday, July 20, 2006 4:39 PM
Categories: 70 LabVIEW Examples-Archive